
Cost Explorer gives you a per-cloudspace breakdown of what you're spending on Rackspace Spot, so you can see daily trends, compare cost categories, and drill into which compute resources are driving your bill.
Accessing Cost Explorer
Sign in to the Spot console.
In the left navigation, select Manage.
Choose the Cloudspace you want to review.
Select Cost Explorer from the Cloudspace menu.
Cost Explorer is available once a Cloudspace has finished deploying. While a Cloudspace is still deploying, this menu item is disabled.
Page overview
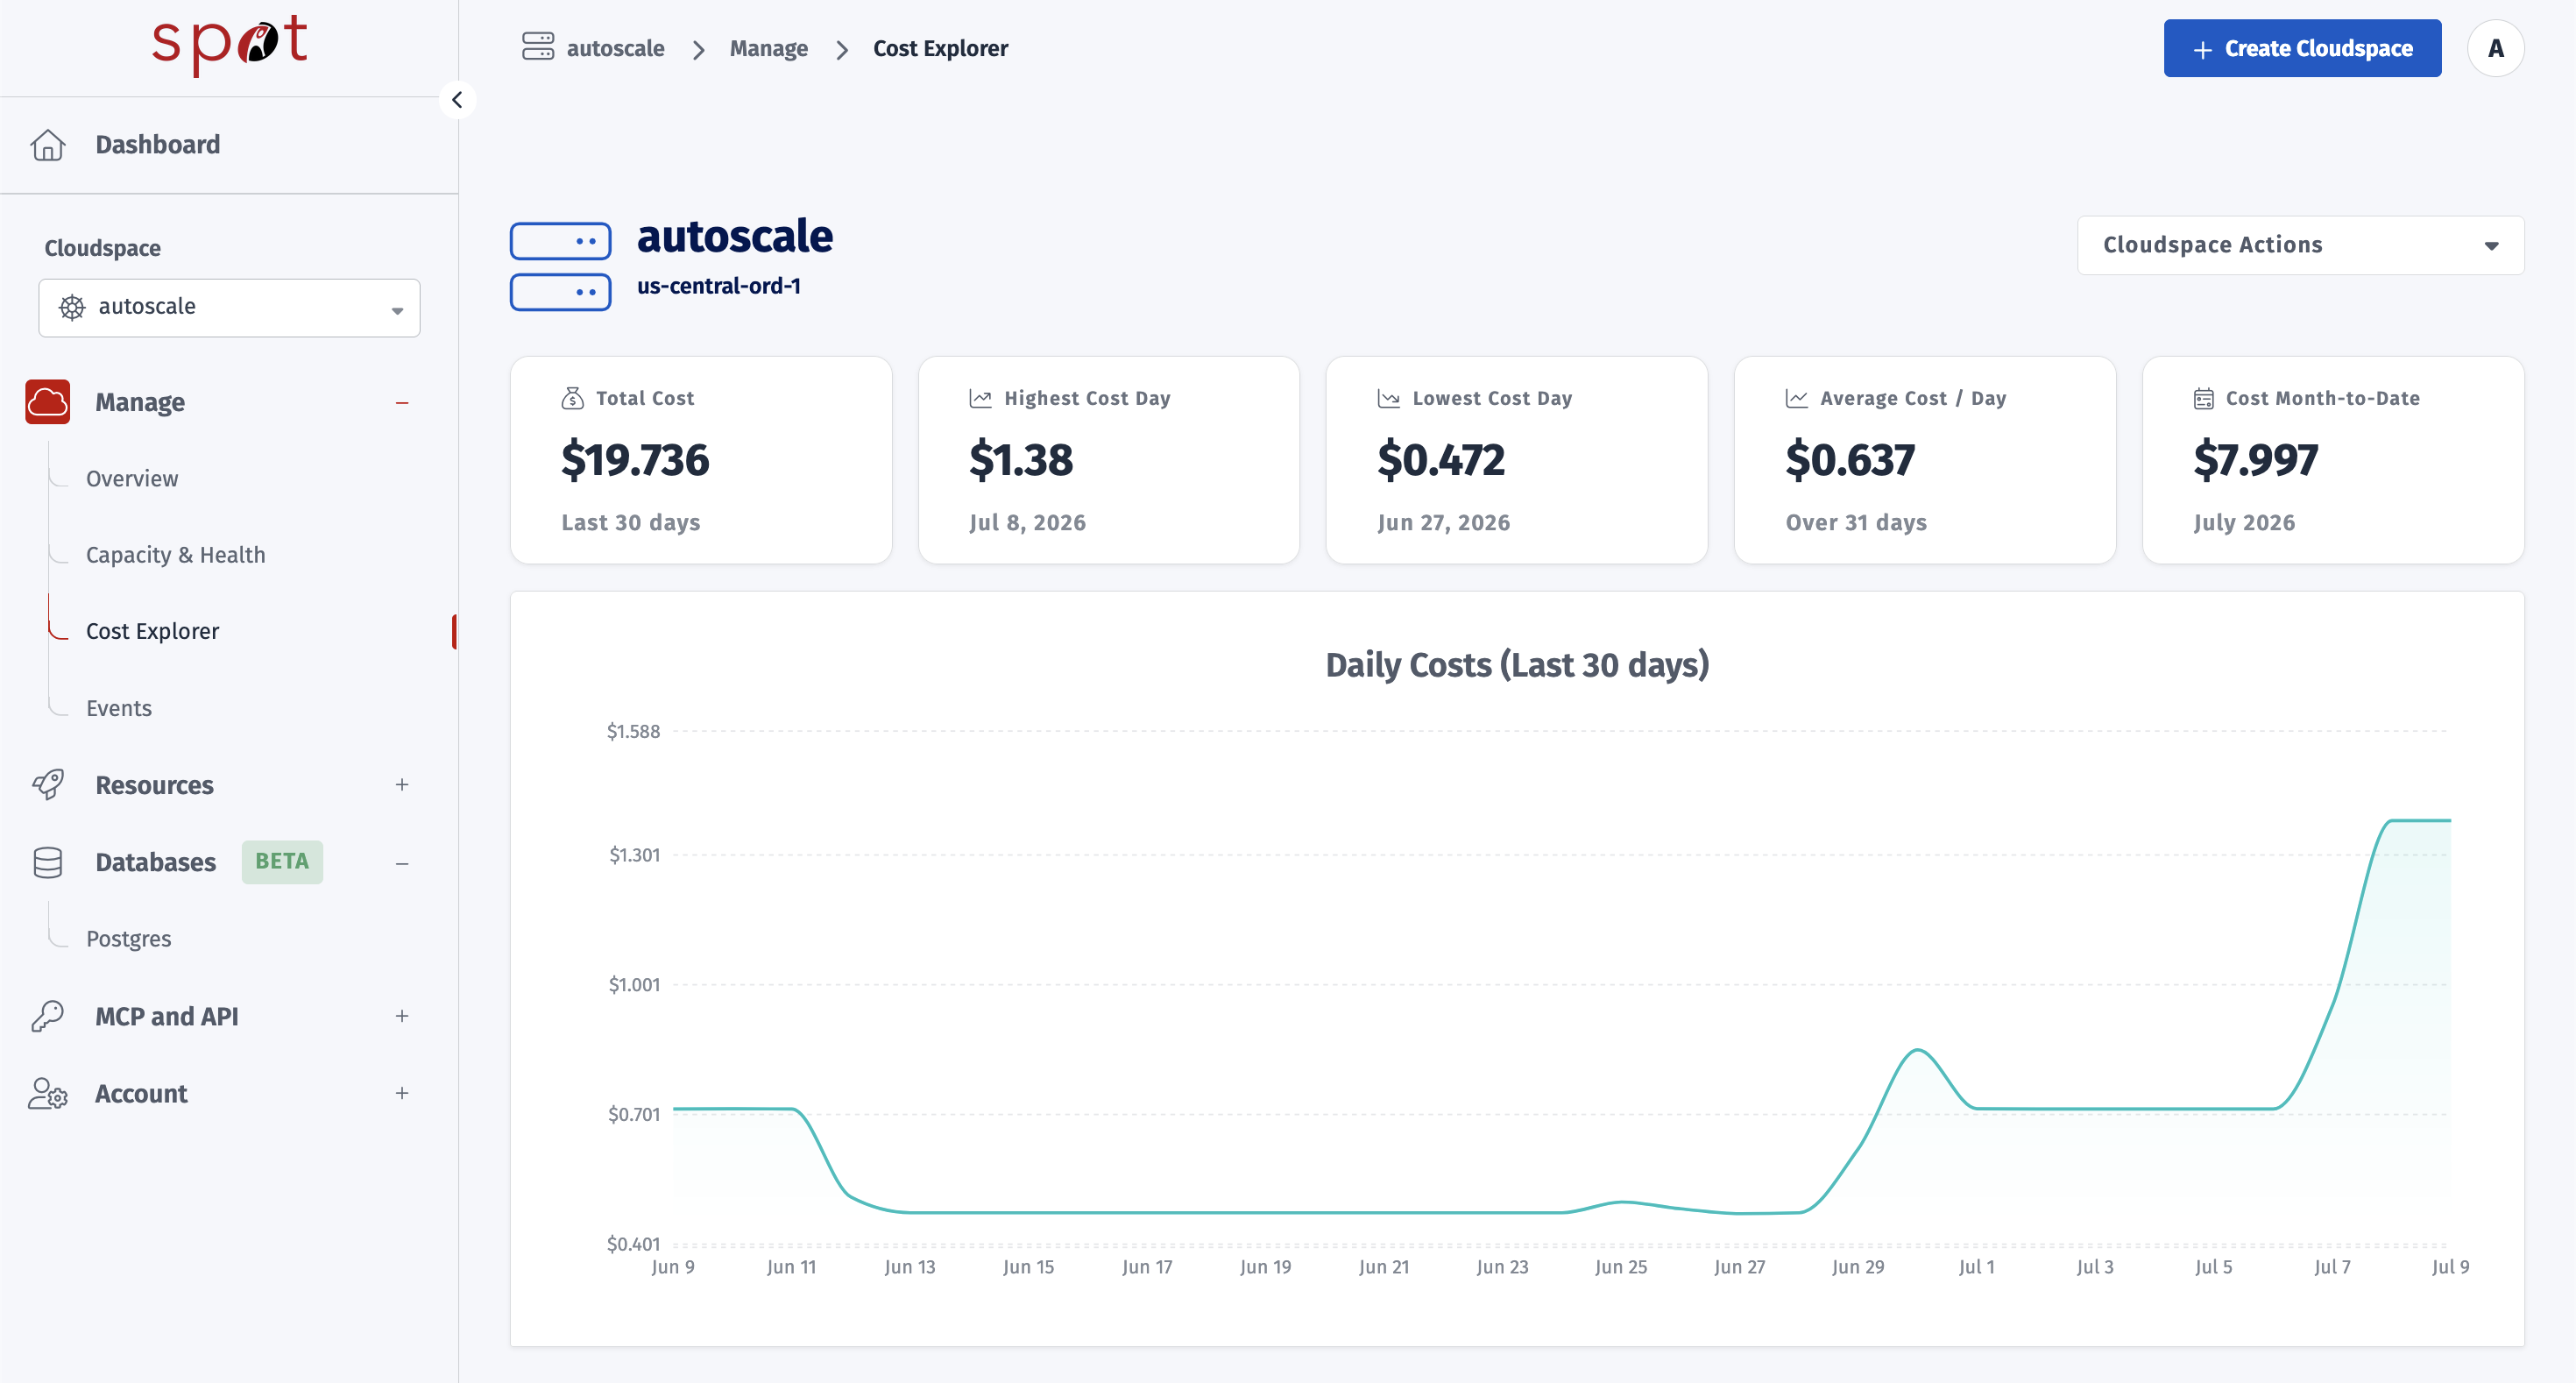
The Cost Explorer page has five parts:
Summary cards — headline numbers for the last 30 days and month-to-date.
Daily Costs chart — a trend line of total daily spend over the last 30 days.
Cost Breakdown by Category — a stacked bar chart split by cost category, per day.
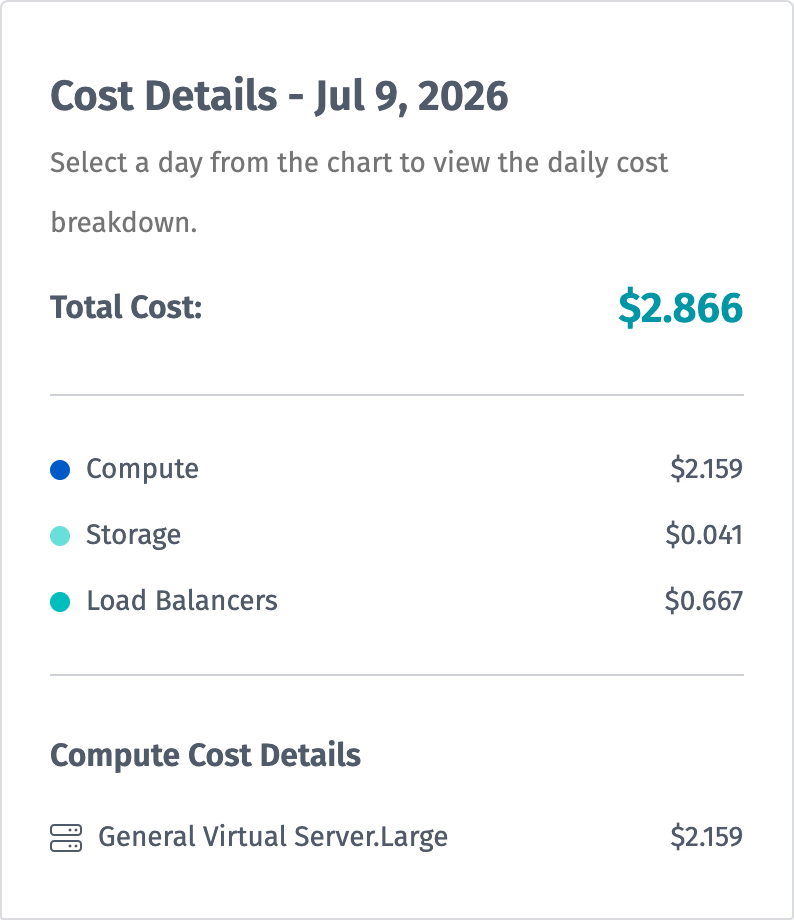
Cost Details — a breakdown for whichever day you select in the chart.
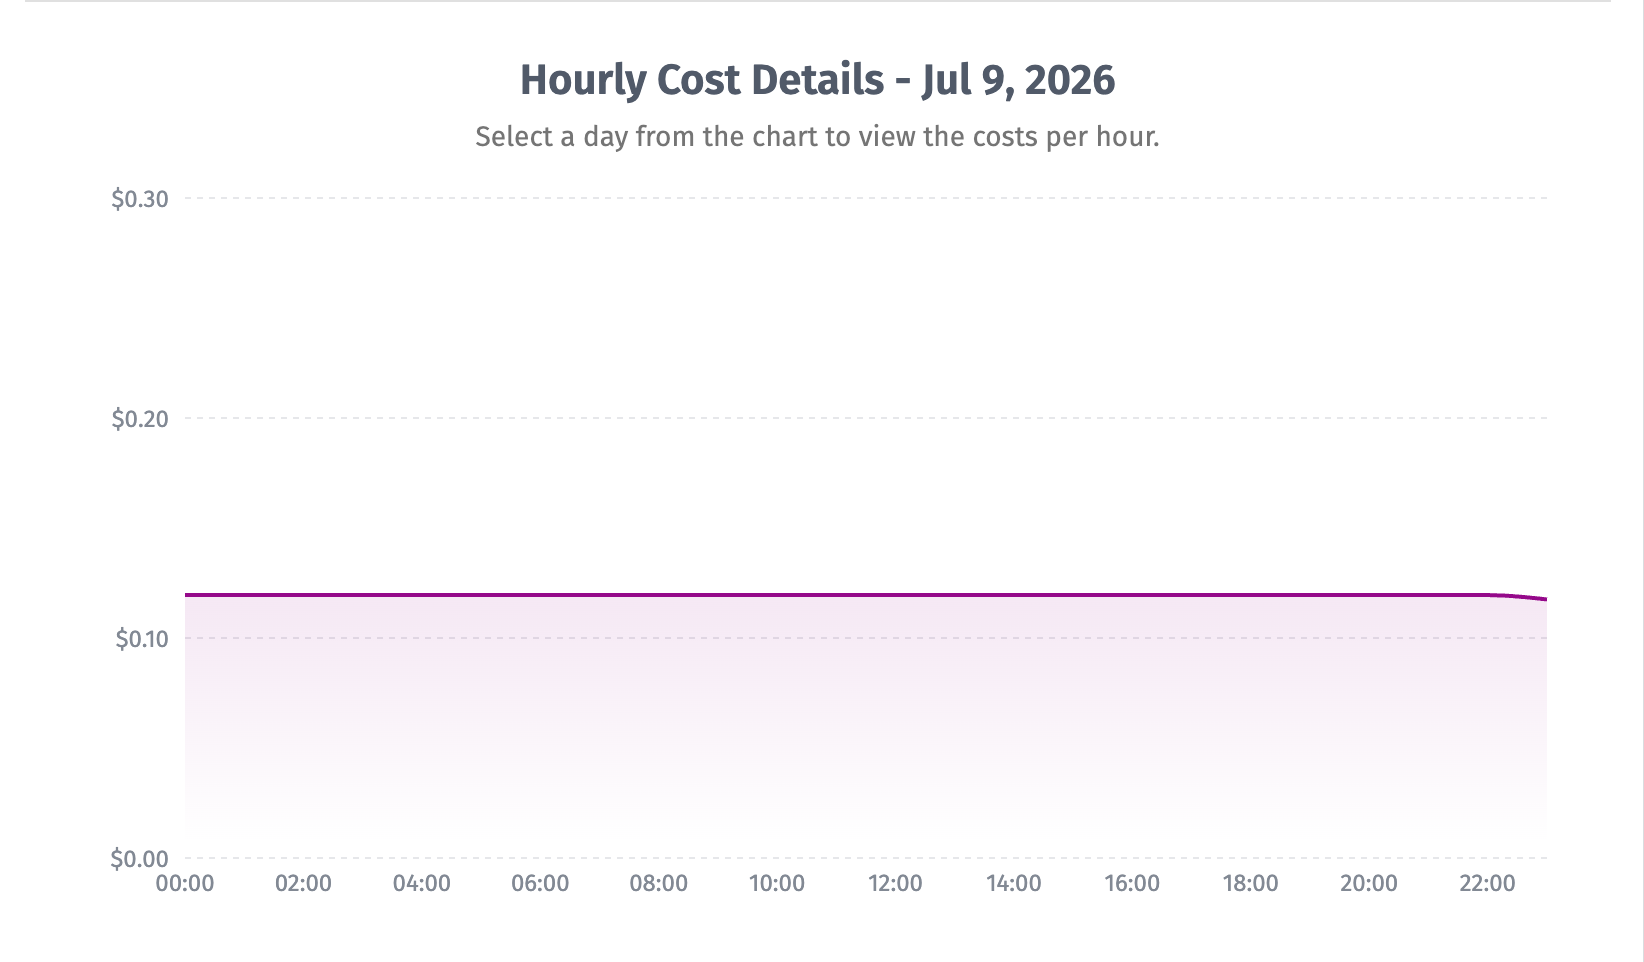
Hourly Cost Details — per-hour costs for the selected day.
Summary cards
Five cards summarize spend at a glance:
Total Cost — sum of all costs over the last 30 days.
Highest Cost Day — the single most expensive day in the last 30 days, with its date.
Lowest Cost Day — the least expensive day in the last 30 days, with its date.
Average Cost / Day — total cost divided by the number of days in the window.
Cost Month-to-Date — sum of all costs so far in the current calendar month.

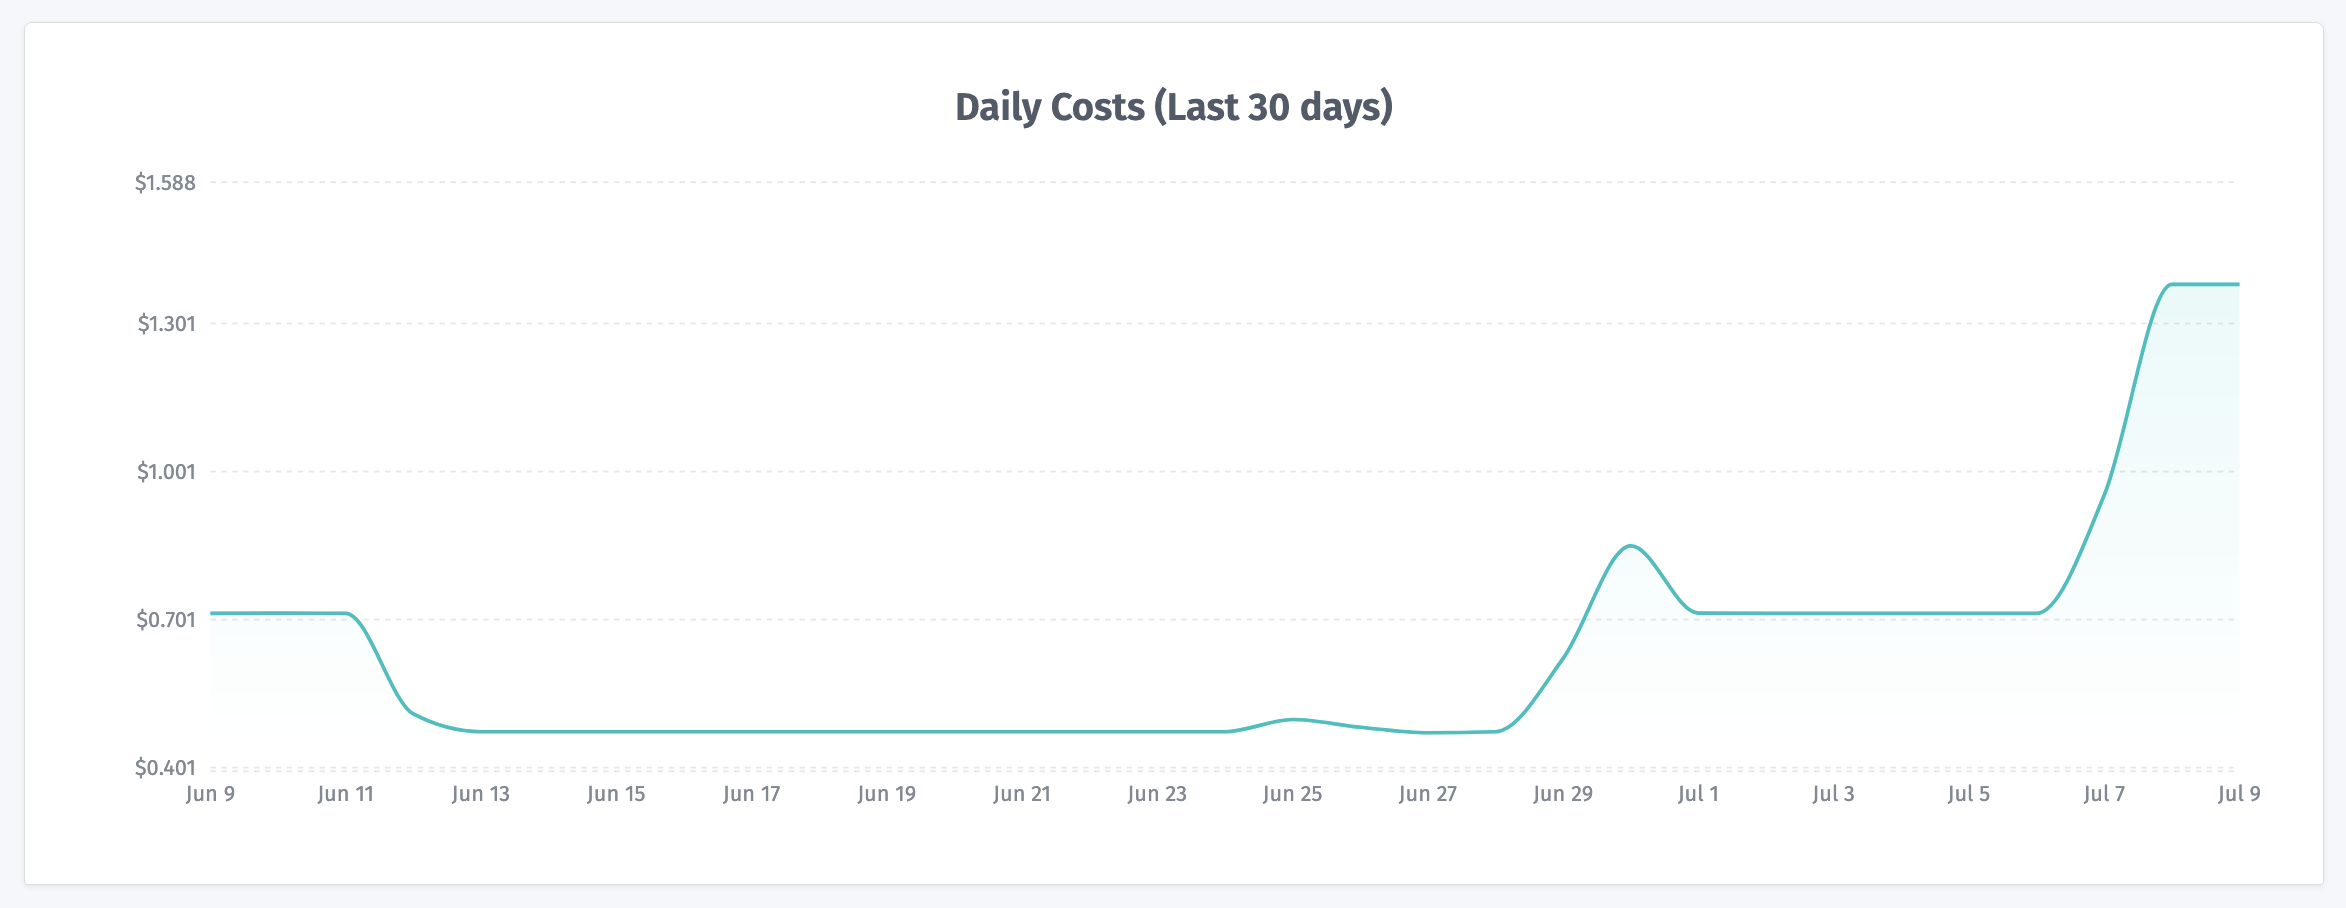
Daily Costs chart
This chart plots total cost per day over the last 30 days, so you can spot spikes or trends in spend at a glance. Hover over any point to see the exact total for that day.
Cost Breakdown by Category
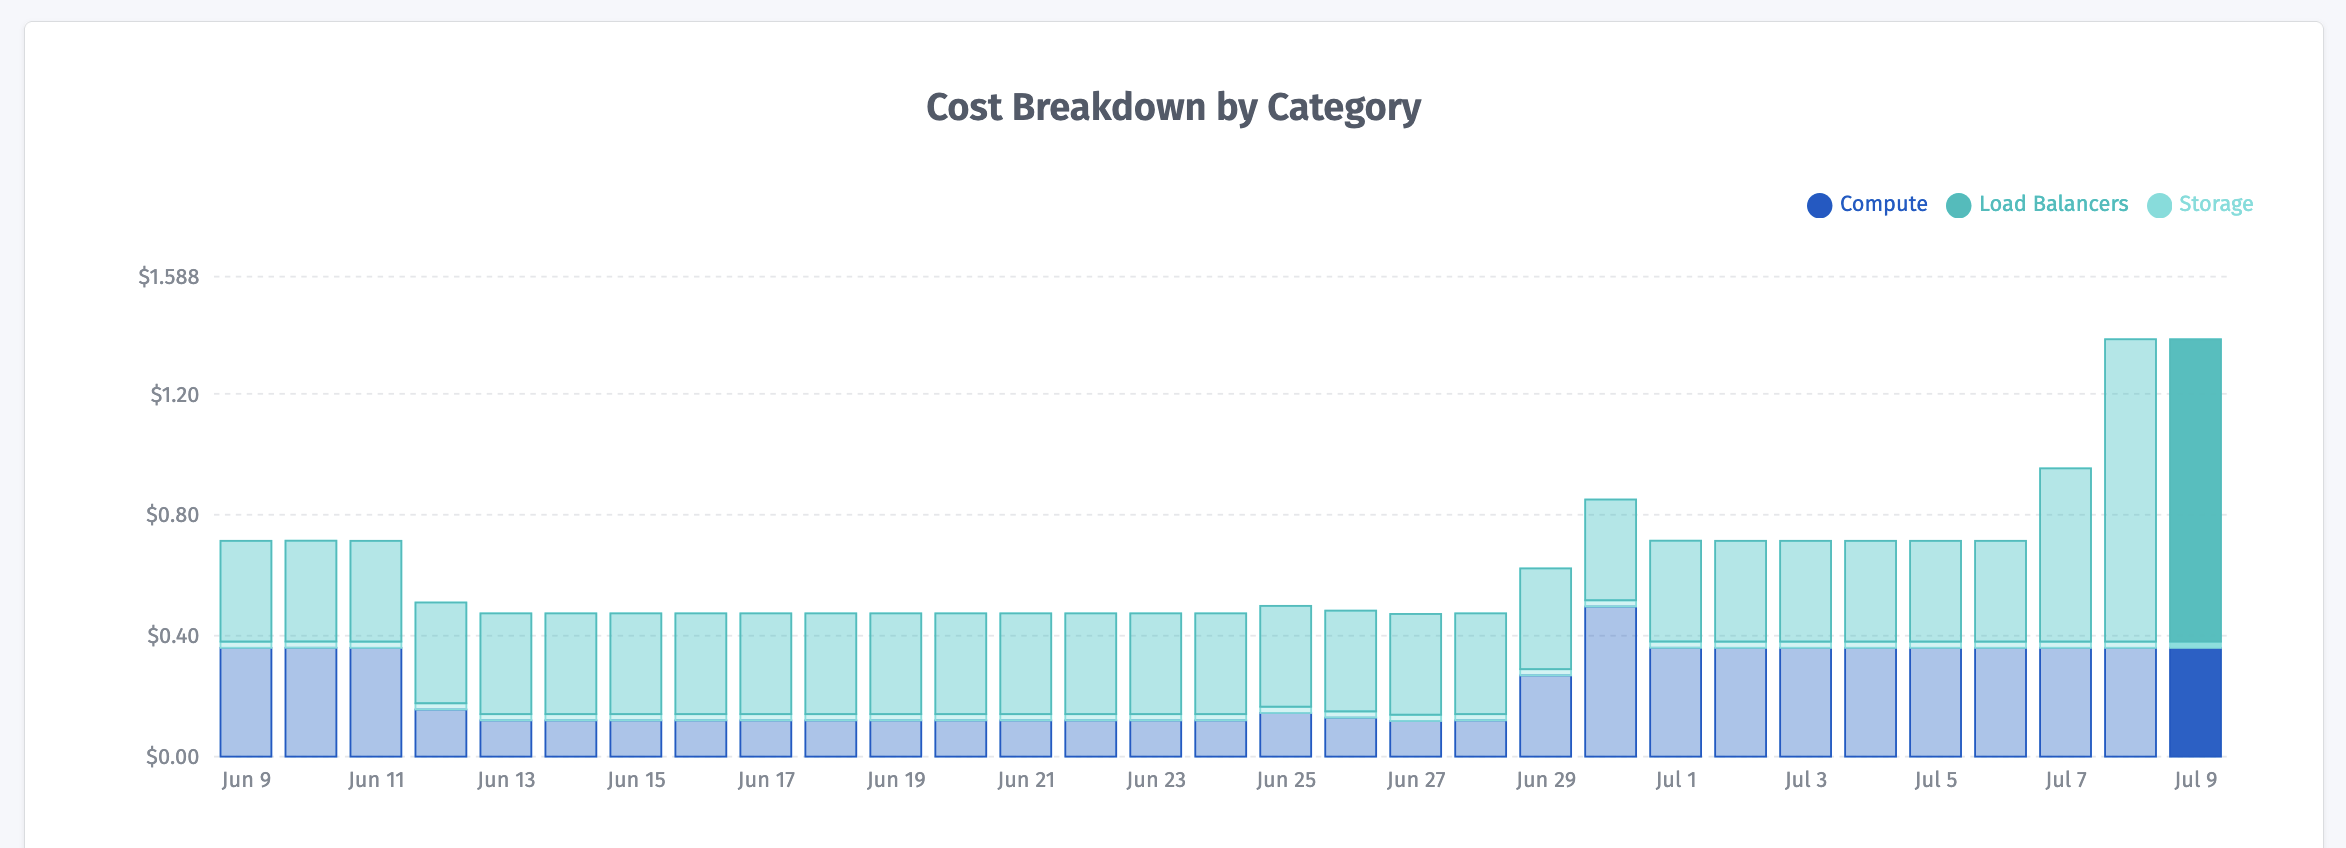
This chart breaks each day's spend down into cost categories:
Compute — VM and node costs
Storage — persistent volume costs
Load Balancers — load balancer costs
High Availability — control plane HA costs (only shown for cloudspaces with an HA control plane enabled)
Hover over a bar to see the cost per category for that day. Click a bar to select that day — this updates the Cost Details panel with that day's breakdown.
Cost Details
Selecting a day in the breakdown chart populates this panel with:
Total Cost for the selected day
A category breakdown (Compute, Storage, Load Balancers, and High Availability if applicable), matching the colors in the chart above
Compute Cost Details — cost broken down by server class (instance type), so you can see which node types are contributing the most to compute spend
Hourly Cost Details
Alongside the Cost Details panel, Cost Explorer shows an hourly cost chart for the day you selected. This is useful for correlating cost spikes with specific times of day — for example, checking whether a burst of autoscaling activity in the afternoon drove up that day's total.
If no hourly data is available for the selected day, this section shows a placeholder message instead of an empty chart.
Frequently asked questions
What time range does Cost Explorer cover?
The daily chart and summary cards cover the trailing 30 days, plus a separate month-to-date figure for the current calendar month. Hourly detail is available for the same 30-day window, viewed one day at a time.
What currency is shown?
All costs are shown in USD.
What timezone are the dates in?
Daily and hourly cost data is bucketed in UTC.
Why don't I see a High Availability line?
The High Availability category only appears for cloudspaces that have an HA control plane enabled. Cloudspaces without HA won't show this category.
Why is a section showing "No data available"?
This means billing data hasn't been recorded yet for that time range — for example, a Cloudspace that was just created, or an hour with no hourly detail available yet.